Power BI and Tableau – are the flagship data analytics tool from the house of Microsoft and SalesForce. Say goodbye to analyzing data using programming languages like R. Say goodbye to the dark days of using plain vanilla spreadsheets that would give up whenever the amount of data increased. Visualize complex data, and gain actionable insights within seconds!

Shine Light On Your Dark Data With Power BI & Tableau

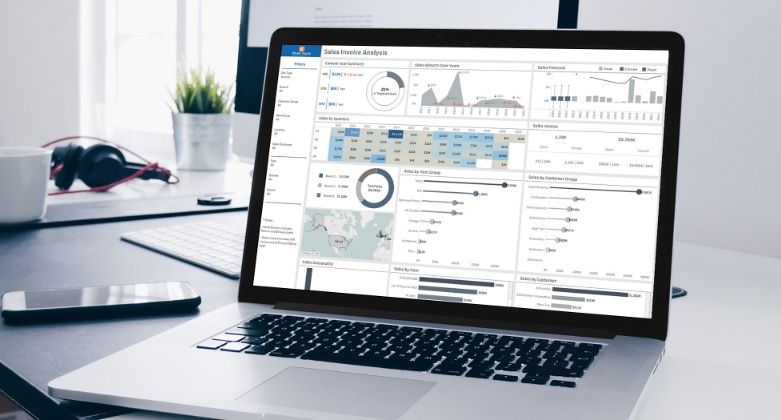
Data Analytics With Microsoft Power BI Dashboard
You can’t readily ingest and analyze big data. You need to first store the unstructured and semi-structured data and then clean it. The cleaned data should ideally be kept in separate storage. Microsoft Power BI – which is a part of the Microsoft Fabric ecosystem – allows you to segregate unstructured and prepped data.

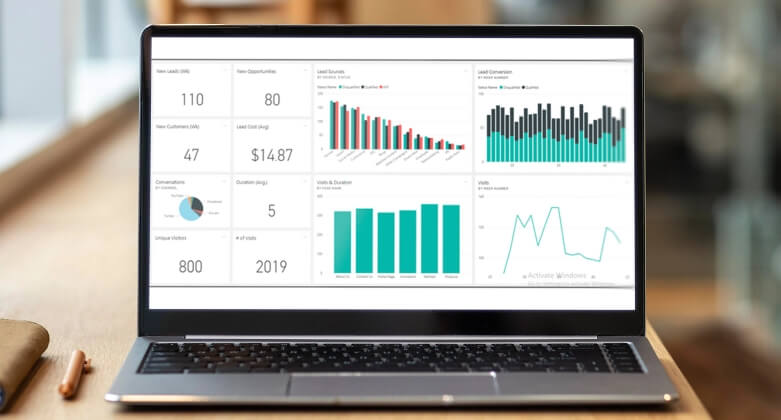
Data Visualization and Analytics With Tableau
Tableau is a leader in the data visualization field. Although it has its own data prep tool, it is more geared towards advanced data visualization – that too without the need for any code.
Let’s look at how Tableau handles the data visualization using the same data set. To get started with data visualization in Tableau, just click on the ‘Workbook’ option and upload the dataset or connect to a data source.
The Benefits of Tableau Data Analytics and Power BI

Ease of Use

Low Learning Curve

Customizable Dashboard

Connect With All Popular Data Sources

Cost Effective

Text-Based Data Visualization

Real-time Data Analytics

Collaboration & Sharing
Tableau and Power BI Empower Companies Across All the Industries

Sales & Marketing

Healthcare

IT and Telecom

Finance

Manufacturing
Your data is valuable. Leverage it today!
Contact Silver Touch Technologies To Implement Power BI in your organization.
Tableau Big Data Analytics Tool

Power BI Visualization

No-Code Data Visualization With Power BI Dashboard
It is not possible for a human being to find key insights hidden inside millions of rows of data. When you visualize the same dataset – the bars and lines, and charts empower decision-makers to identify those hidden insights.
Power BI dashboard features an easy drag-and-drop functionality for data visualization. Once the data is ingested and cleaned, you can use this data to create awesome visualizations and data stories. Just click on the Create button to get started.
The Power BI data analytics enables us to easily understand the sales trend. We can see that over the three-year period, Euro Shopping Company has bought Classic Cars on a consistent basis – there is more or less no reduction in the number of this product ordered.
Why Choose Silver Touch for Power BI and Data Analytics Services?
You must have heard the term – Garbage In, Garbage Out. This is true for data visualization and data analytics as well. Contact Silver Touch Technologies for a 360-degree implementation of Power BI or Tableau. Our Data Engineers are adept at building a robust Data Engineering pipeline. Engineered Data is the soul of Data Analytics.